Assessment Indicators: Legend
Colour Legends: Explained
Essential Assessment uses colour-coded icons to show student progress at a glance. Here's what each symbol means and where you'll find it across your reports.
|
Label |
What It Means |
When It Appears |
Which report |
|
|
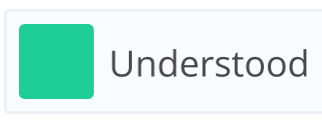
The student has demonstrated understanding of the skill. | When the student answers a majority of questions correctly. | A.S.R, Z.P.D, Strand Overview, Continuum Results (NSW), My Numeracy/My Literacy |
|
|
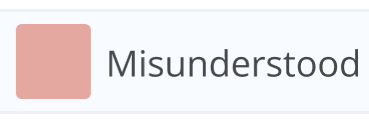
The student has not yet demonstrated understanding. | When a student does not answer enough questions correctly to demonstrate understanding. | A.S.R, Z.P.D, Strand Overview, Continuum Results (NSW), My Numeracy/My Literacy |
|
|
The student is unsure or lacks confidence. | When a student does not answer enough questions correctly to demonstrate understanding and selects ‘I don’t know yet’ for the majority of incorrect questions. | A.S.R, Z.P.D, Strand Overview, Continuum Results (NSW), My Numeracy/My Literacy |
|
|
No data available for this skill. | When the student has not been assigned the content or no result exists. | A.S.R, Z.P.D, Strand Overview, Continuum Results (NSW), My Numeracy/My Literacy |
|
|
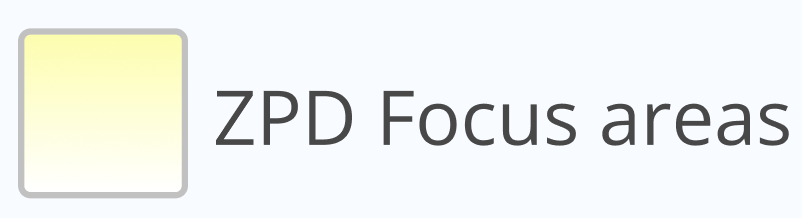
These skills are ideal next steps and can be achieved with support. | When the skills could be achieved with guidance. | A.S.R, Z.P.D, Strand Overview, Continuum Results (NSW), My Numeracy/My Literacy |
|
|
Indicates that students in the class have shown growth in this specific area. | When one or more students have demonstrated improvement between pre-, mid-, or post-assessments. |
A.S.R, Strand Overview, Continuum Results (NSW) |
|
|
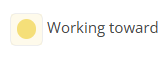
The student has been assigned a My Literacy or My Numeracy activity. | The task is set but not yet opened by the student. |
My Numeracy/My Literacy |
|
|
The student has begun working on My Literacy or My Numeracy activity. | The student has begun the activity but has not yet completed it. |
My Numeracy/My Literacy |
|
|
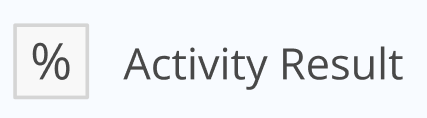
The student has demonstrated mastery of a My Literacy or My Numeracy activity and is ready for assessment. | The student answers a majority of activity questions correctly. |
Strand Overview, My Numeracy/My Literacy |
|
|
The student has completed the My Literacy/My Numeracy activity for the strand but has not yet mastered it. | The activity has been finished without answering enough questions correctly for mastery. |
Strand Overview |
|
|
The student has completed a My Numeracy or My Literacy activity but has not yet mastered it. The percentage is the total questions correct. |
Appears in My Literacy or My Numeracy view. The colour background changes based on the percentage of correct answers:
|
My Numeracy/My Literacy |
|
|
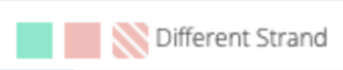
The student has a result of Understood, Misunderstood, or Primarily Unanswered | Appears as a faded, smaller square when a student has a result from another Strand. | Multi-Strand Assessments such as Flexi assessments and Units of Work (NSW). |


Understanding Percentages: ASR, Z.P.D, and Strand
|
|
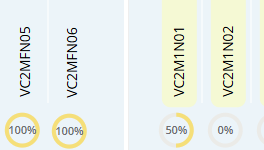
Shows the percentage of students who have been assessed on this code and have demonstrated understanding. Green indicates the percentage of students who have demonstrated growth in the class. | Displayed when hovering over the curriculum code. The yellow rings represent the proportion of assessed students who demonstrated understanding. | A.S.R |
|
|
Shows the percentage of students who have been assessed on this code and have demonstrated understanding. | Displayed when hovering over the curriculum code. | Z.P.D |
|
|
Shows the percentage of students who have been assessed on this outcome and have demonstrated understanding. Only students who have completed an assessment for this content are included. | Displayed beside each curriculum code whenever at least one student has been assessed. | Strand Overview |
|
Element |
What It Means |
When It Appears |
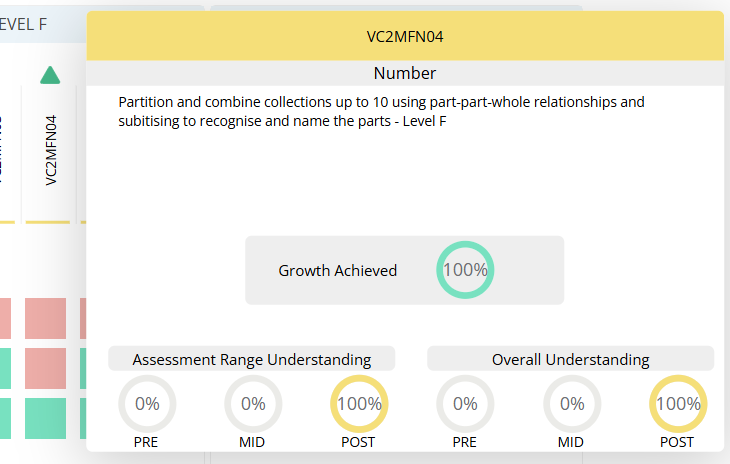
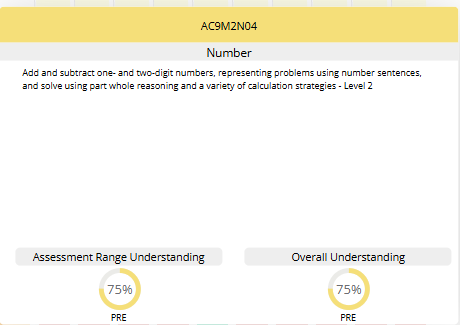
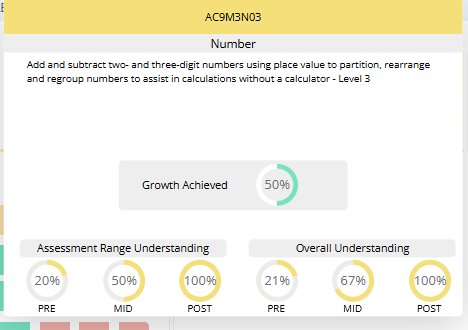
| Growth Achieved (Green Arc) | Shows the percentage of students in the assessment range who now demonstrate understanding in the post-assessment but did not demonstrate it in the preceding assessment. | Displayed when two assessment points exist and growth can be calculated across PRE, MID or POST. |
| Assessment Range Understanding | Indicates the percentage of students assigned to this assessment range (e.g. Level 1–2, 2–3) who have demonstrated understanding at PRE, MID or POST. | Appears only for assessment points that exist (PRE, MID, POST). The yellow segment represents the proportion understood. |
| Overall Understanding | Shows the percentage of students across the whole class who have demonstrated understanding at each assessment point. | Appears when PRE, MID or POST results exist. Increases as more students demonstrate understanding. |
| Growth Achieved | Represents the increase in the percentage of students in the assessment range who now demonstrate understanding compared to earlier assessments. | Appears within the ‘Growth Achieved’ display when two assessments have been completed. |
How ‘Primarily Unanswered’ Is Calculated

If a student does not meet the threshold for ‘Understood’, their result is shown as ‘Misunderstood’.
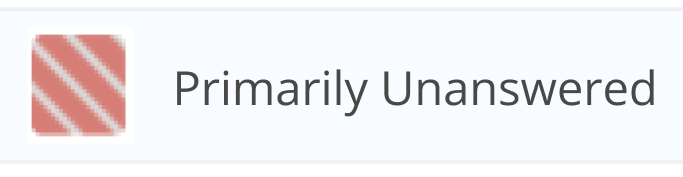
- If the student has misunderstood and selected more 'I don't know yet' responses and/or skipped more questions more than incorrect answers, their result is shown as Primarily Unanswered (red diagonal stripes).
- If incorrect answers are more than ‘I don’t know yet’ responses, the result remains Misunderstood (red).
This distinction helps show whether a student is unsure or has attempted the work but misunderstood the content, supporting more targeted teaching decisions.