Understanding why a mid-assessment score may be lower than a pre-assessment score
It can be surprising when a student achieves a higher score in a pre-assessment than in a mid-assessment, but this outcome is not uncommon and often reflects the nature of learning, assessment design, and the role of memory. Here are some important considerations to help interpret these results accurately and support next steps in student learning.
In this article:
- Dynamic mode in pre-assessments can broaden results
- NSW Syllabus example: Number and Algebra Common Grade
- Australian Curriculum example: Number General All
- Victorian Curriculum 2.0 example: Number General All
- Lack of progress or reinforcement between assessments
- Summary: key points to communicate with educators
- Recommendations
Dynamic mode in pre-assessments can broaden results
When Dynamic mode is enabled during a pre-assessment, students are exposed to questions across more than two years of curriculum content. This broader scope can lead to:
- Exposure to a wide range of content, including material beyond the current expected level
- Students answering some higher-level questions correctly, which inflates their overall result
- An overall result that reflects success across a larger content span, not just the stage the student is currently working in
In contrast, the mid-assessment usually focuses only on the two-year content range in which the student is placed after the pre-assessment. This tighter focus:
- Narrows the question range to consolidate understanding
- Leads to a result that is more specific, and therefore often lower than the pre-assessment
Important considerations:
- When reviewing results, check the “range of curriculum coverage” to understand the content on which the result is based
- Do not compare the percentage results, as these may be based on different assessment lengths and are not an accurate representation of growth
NSW Syllabus example: Number and Algebra Common Grade
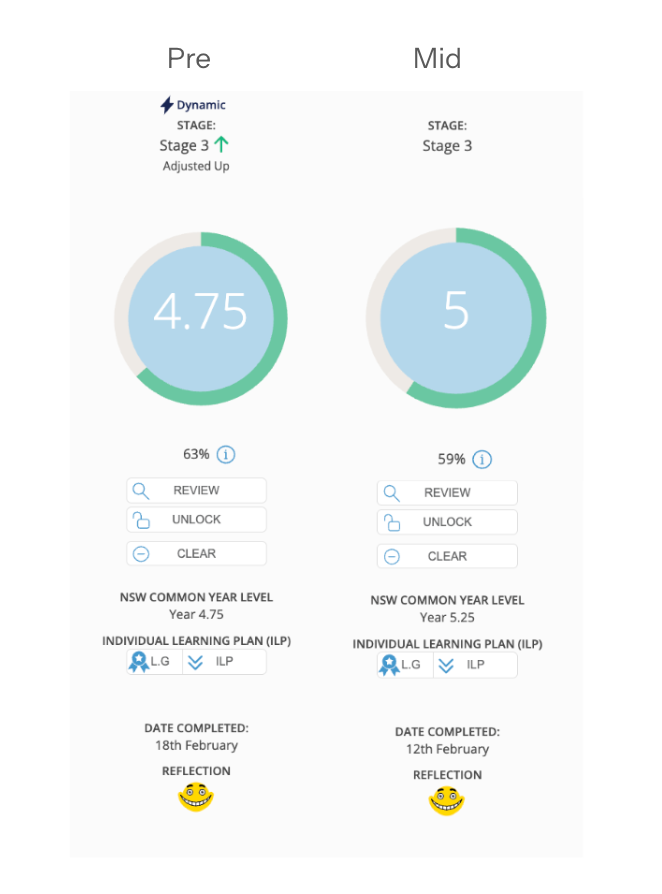
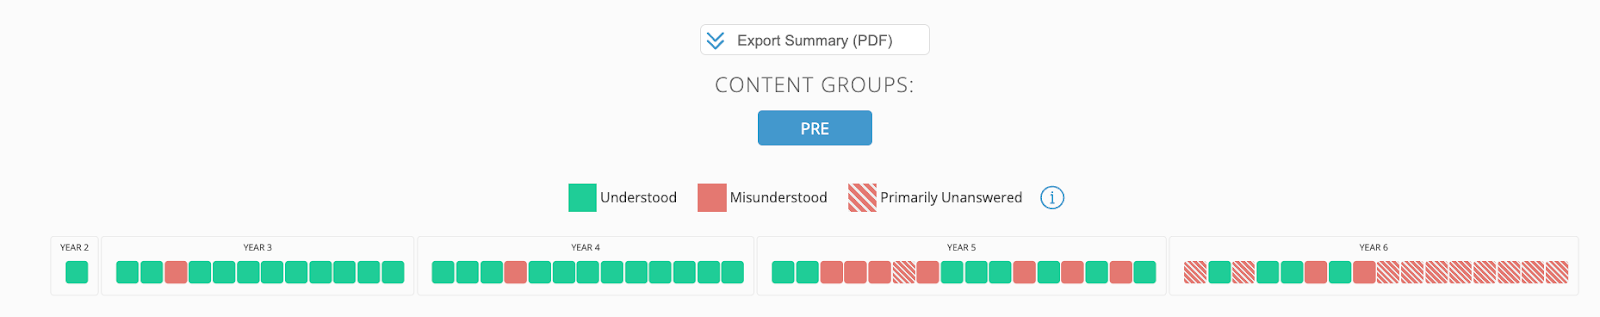
When the student was pre-assessed, they started in Stage 2 and they were dynamically adjusted upward (indicated by the lightning bolt and green arrow pointing up) and finished in Stage 3. The questions covered the range of years from Year 3 to Year 6 (Stage 2 AND 3). The overall result reflected understanding across these 2 stages as seen by scrolling down further to look at the summary overview. Dynamic was turned OFF for the mid-assessment (no lightning bolt). This allowed the student to be assessed showing evidence of understanding of the content located within the student’s ZPD as identified from the pre-assessment. This is the recommended advice.
The pre-assessment result was calculated based on the understanding shown in all 2 stages - 4 year levels as 4.75, reflecting understanding up to the end of Year 4 and three-quarters of the way through Year 5 content.
The mid-assessment result reassessed just Stage 3 content, and the student demonstrated a little more understanding of the Year 5 content as was shown in the pre-assessment, which affected their overall result. Resulting in a score of 5.0.
Please note that the percentage result is of the number of questions the student received at each point in time, which is not helpful when comparing these two assessments, as the student was exposed to a different number of questions.

Although sometimes the overall result may not reflect growth, the student has gained an understanding of additional outcomes when examining the Growth tab within the individual profile.
Australian Curriculum example: Number General All
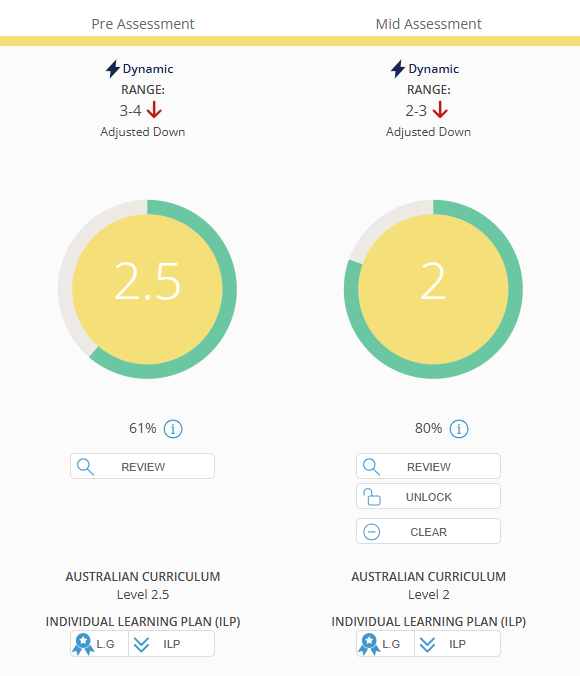
When the student was pre-assessed, they started with the Year 4-5 content, and they were dynamically adjusted down (indicated by the downwards arrow) finishing in Year 3-4. The questions covered a range of years from 3 to 4, as the student did not demonstrate sufficient understanding of Year 4 content to be exposed to Year 5 content. See the summary overview below.
It is NOT recommended for Dynamic to be engaged for mid/post assessments; however, in this example, Dynamic was left on for the mid-assessment, so the student was dynamically adjusted down again. This is why we recommend leaving Dynamic off, so you do not run the risk of students regressing dynamically. Instead, reassess them within their ZPD.
Please note: Comparing percentages does not accurately represent growth. Only the Level should be examined, as the number of questions answered correctly in the pre-assessment reflected a percentage of 61% (19 correct out of 31 questions) versus the percentage of 80% (21 correct out of 25 questions) for the mid-assessment.
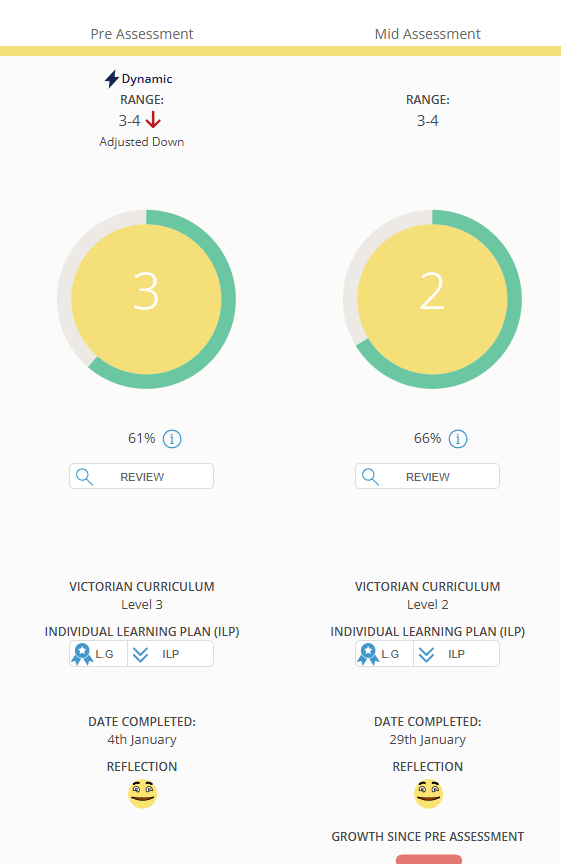
The student began the pre-assessment with a 4-5 range and did not demonstrate sufficient overall understanding at this level to be offered Year 5 questions. Consequently, the student was dynamically adjusted back to Year 3 content, resulting in a ZPD range of levels 3-4.
For the mid-assessment, the student began with Year 3 content, as the pre-assessment ZPD was located at 3-4. However, because there was not enough overall understanding shown at level 3 and Dynamic was ON, the student went back down and completed their assessment at Year 2. This impacted the overall outcome, and the growth was not reflected in the final result.
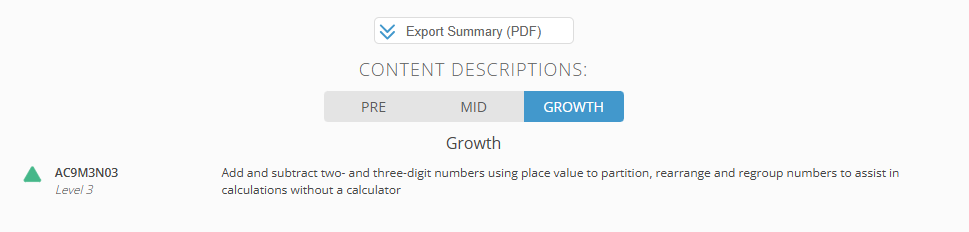
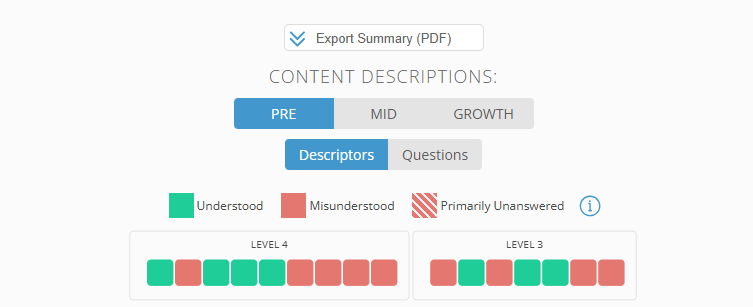
Although the overall result does not reflect growth, the student has gained an understanding of one additional content descriptor when examining the Growth tab.
Victorian Curriculum 2.0 example: Number General All
When the student was pre-assessed, they started with Year 4-5 content, and they were dynamically adjusted down, finishing in Year 3-4. The questions covered a range of years from 3 to 4, as the student did not demonstrate sufficient understanding of Year 4 content to be exposed to Year 5 content. See the summary overview below. Dynamic was turned off for the mid-assessment to reassess the student within their ZPD and prevent the student from regressing.
Please note: Comparing percentages does not accurately represent growth. Only the Level should be examined, as the number of questions answered correctly in the pre-assessment reflected a percentage of 58% (22 correct out of 38 questions) versus the percentage of 80% (25 correct out of 38 questions) for the mid-assessment. The overall level result was higher for the pre-assessment than the mid-assessment based on the amount of content understanding demonstrated.
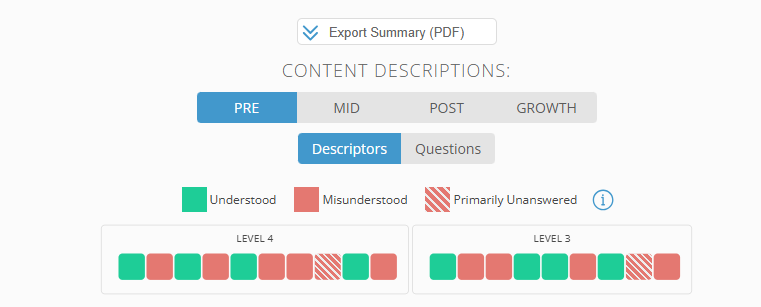
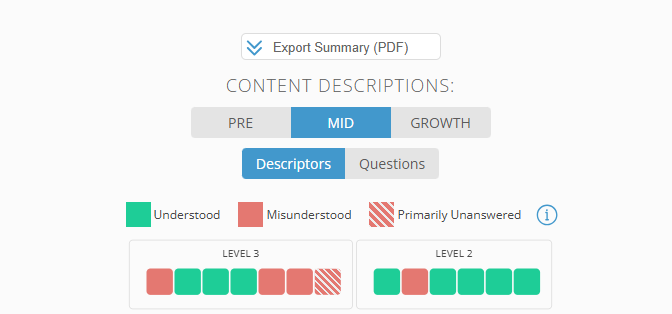
The student began the pre-assessment with a range of Year 3-4. Note that the Green, red, and striped squares summarise the overall content the student was offered in each year level. The result of 3 indicates the average of end of year Year 3 of beginning of Year 4 based on the gaps in understanding across both year levels.
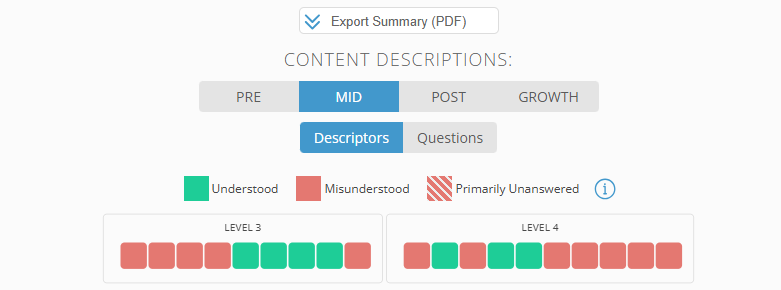
Comparing the pre- and mid-assessments, the student had a similar weighting of content knowledge in Year 3, although they did not demonstrate an understanding of the same content descriptors. The difference in the overall result can be attributed to more gaps in understanding at the Year 4 level compared to the pre-, indicating that the student may not have transferred learning to long-term memory and was unable to retrieve information at the time of the assessment.
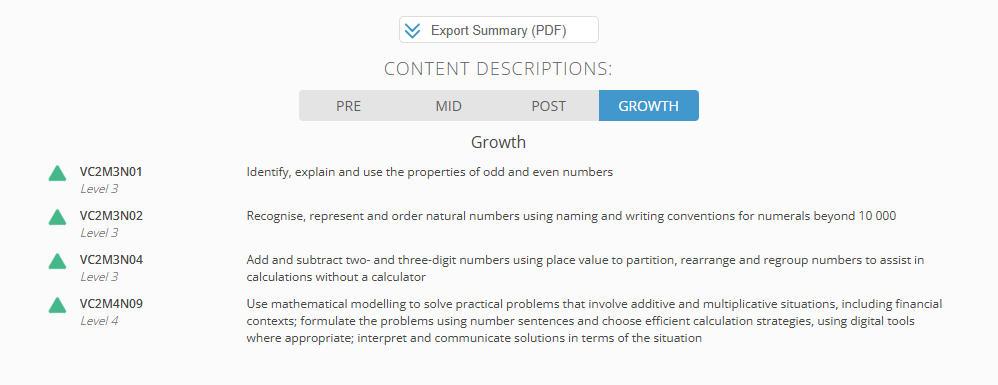
We can see in the above that the student has gained an understanding of these additional content descriptors when examining the Growth tab.
Lack of progress or reinforcement between assessments
If a student does not show improvement or re-demonstrate understanding of key skills and knowledge areas from the pre-assessment, the mid-assessment score may reflect this. Consider the following:
- Students may have correctly answered certain content descriptors or groups in the pre-assessment but failed to do so in the mid-assessment
- The student may not yet have demonstrated growth in new content areas
- This does not necessarily indicate regression - it may reflect consolidation in progress or content that needs to be revisited
✅ Tip: Use the Summary Tabs within Essential Assessment to look at:
- Content Descriptor/Group comparisons
- What has been retained or forgotten
- Evidence of growth, even if it is small or not yet reflected in the overall score
Summary: key points to communicate with educators
|
Factor |
Impact on Assessment Results |
| Dynamic Mode Pre-Assessment | Broader content = potentially inflated results |
| Mid-Assessment Scope | Narrower range = more focused (often lower) result |
| Lack of Redemonstration | May suggest forgotten or unconsolidated learning |
| Memory & Retrieval Science | Results can vary based on spacing, rehearsal & reinforcement |
Recommendations
- Use assessment data as one piece of a broader learning profile
- Pair assessments with observational and formative data
- Review content descriptors side by side between assessments to check for consistency and identify gaps
- Plan for targeted revision and retrieval practice to strengthen long-term retention
- The use of My Numeracy/My Literacy will strengthen retrieval practice